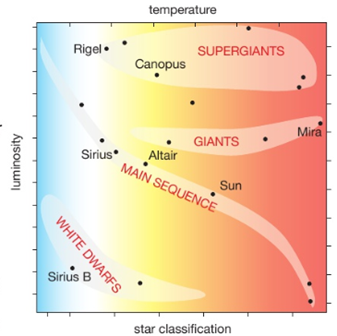
This diagram shows the relationship between a star’s luminosity (its brightness or power output) and its surface temperature. A star moves to different positions in the diagram during its life, as its internal structure and temperature change.
Important Note: the temperature scale is reversed. It is hotter towards the origin of the x axis.


